
Problem Recognition and Definition
The volatility of US Dollar seen in recent year has led to high uncertainty for project cost estimation. In addition, all major currencies in the world are experiencing fluctuations in recent years [1], especially with a gloomy economic condition globally. This has created a need to explore alternative currency or commodity as basis for future project cost estimations.
Problem Definition: To find a stable currency or commodity that could be projected for future cost estimation
Development of feasible alternatives
The alternative required as basis of cost estimation has to be predictable (consistent or following a certain pattern). Thus to begin, three different index/prices are evaluated to determine their predictability using historical data of last 17 years (1995-2011). The three index/prices used are:
-
US Inflation rate
“Inflation rate is defined as annualized percentage growth of some broad index of money prices.”[2] Generally, all costs and prices are subjected to inflation or deflation due to local and global conditions. Hence, incorporating inflation rate trend makes a feasible alternative for this case.
-
US Dollar Index
The US Dollar Index measures the value of US dollars against a basket of six major currencies and adjusts for the impact of inflation [3]. This index is a feasible alternative to evaluate the trend of the index and predictability.
-
Gold Price
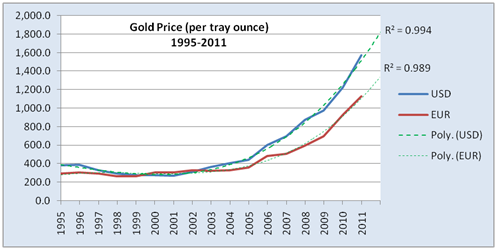
“Gold is considered a safe-haven asset as throughout history it has been viewed as a store of value”[4]. It is a commodity and traded based on supply-demand balance, and does not favor any particular currency or government. This makes gold price a feasible alternative for analysis. To have a better view, the gold prices in two currencies (USD and EUR) were analyzed.
Data Analysis and Results
The tool applied was trending by regression analysis which determines the pattern of historical data and maps to best “fit” mathematical model. To ensure accuracy of analysis, a relatively long period of data was used. Historical data from 1995-2011 (17 years) was used for each analysis. The three charts below show the trending using MS Excel polynomial regression analysis.


Selection Criteria and Preferred Alternative
The criteria used for selection of best alternative will be predictability of the data, to allow accurate forecasting. As such, for regression analysis, Coefficient of Determination, (R2) calculated using MS Excel Charts was the selection criteria. General rule is R2 value should be more than 0.95 to get best prediction models. The table below shows the results for each alternative.

For non-linear regression analysis, the “best fit” is determined by high R2. Hence we select Gold Price (measured in USD per tray ounce) which has R2 value of 0.994 and fits well into polynomial trend line (can output into mathematical model). In comparison, the US annual inflation rate has the lowest R2 score, thus rendering is to be fluctuative and cannot be accurately predicted.
Selection: Price of Gold (USD per tray ounce) will be used as basis for future project cost estimation
Next Steps
The concept of using Gold Price will be further developed to compare with Purchase Power Parity in W3 Blog Posting.
Word Count: 515
References:
1. Lively, J. (2009, Jun 15). Recent currency fluctuations impact on vendors and network operators in emerging markets. Retrieved from: http://www.developingtelecoms.com/recent-currency-fluctuations-impact-on-vendors-and-network-operators-in-emerging-markets.html
2. White, L. Inflation. Retrieved from: http://www.econlib.org/library/Enc/Inflation.html
3. Bivens, J. (2003, Jul 24). The benefits of the dollar’s decline. Retrieved from: http://www.epi.org/publication/briefingpapers_bp140/
4. Why is gold considered a “Safe-Haven”?. Retrieved from: http://www.forexnews.com/questions/why-is-gold-considered-a-safe-haven/
5. InflationData.com. (2012, Jan 30). Monthly Inflation Rate Table. Retrieved from: http://inflationdata.com/Inflation/Inflation_Rate/monthly_inflation.aspx
6. Federal Reserve Bank of Atlanta. Dollar Index Historical Data. . Retrieved from:
http://www.frbatlanta.org/dollarindex/User/dsp_index_menu.cfm
7. KITCO Gold Index. (2012, Jan 30). Gold Historical Charts. Retrieved from: http://www.kitco.com/scripts/hist_charts/yearly_graphs.plx.

BEYOND AWESOME, Hari…… Perhaps one of the best postings I have ever received!!! Even included the word count….. Wow!!!
You are THE Subject Matter Expert on preparing these blogs…..
You followed the Step by Step process perfectly and your references were well done, in APA format……..
The ONLY “complaint” is, according to your early date schedule, this was due NLT Monday night, so you are late in terms of the Early Date Curve, but well within the “envelope” between the ED and LD curves.
One request- as you are clearly “the go to” person for anything to do with the blog postings, can you select a couple of people each week who are struggling (Topan and Mohan come to mind) and help them out, please? Your leadership in that area would be greatly appreciated.
Keep up the good work and really excited to see where you take us next!!
BR,
Dr. PDG, Jakarta
Pingback: W4_Mahfoodha_Stable Trading Currency | PMI-Oman 2014